The Dashboard is your central command center for monitoring and managing your Web Application Firewall (WAF). It provides real-time visibility into security threats, attack patterns, and overall system health across all your protected domains.
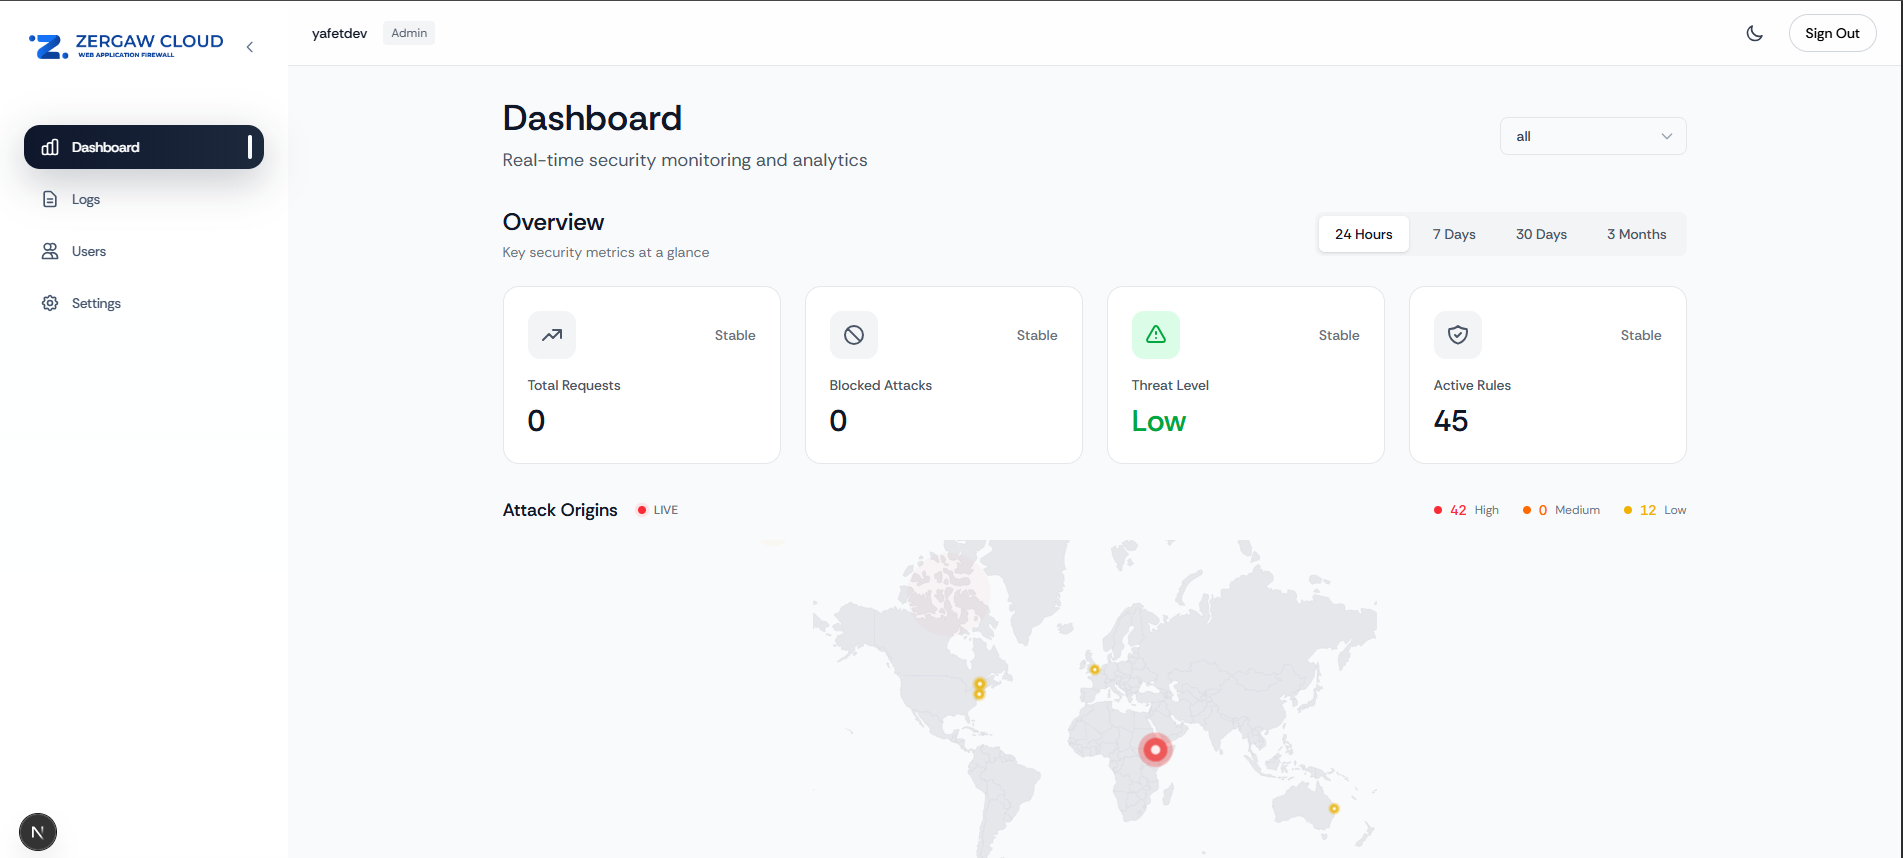
Screenshot: Full dashboard view showing all components
¶ Accessing the Dashboard
- Log in to your WAF management portal
- Navigate to Dashboard from the main menu
- You'll see a comprehensive view of your security metrics
¶ Dashboard Components
¶ 1. Domain/Host Filtering
At the top right of the dashboard, you'll find a Host Selector dropdown that allows you to filter the entire dashboard view by specific domain.
How to use:
- Click the dropdown menu
- Select a specific domain to view metrics for that domain only
- Select "All" to view aggregated metrics across all your domains
Use cases:
- Monitor a specific domain that's experiencing issues
- Compare security metrics across different domains
- Focus on a newly added domain
¶ 2. Overview Statistics
The Overview section displays four key metrics that give you a quick snapshot of your security posture:
¶ Total Requests
Shows the total number of requests processed by your WAF within the selected time range. This includes both legitimate traffic and blocked attacks.
¶ Blocked Attacks
Displays the number of malicious requests that were successfully blocked by the WAF. This metric helps you understand the volume of threats your system is protecting against.
¶ Threat Level
Provides an overall security assessment:
- Critical: High volume of critical or high-severity attacks detected
- High: Significant number of high-severity threats
- Medium: Moderate threat activity
- Low: Minimal threat activity detected
¶ Active Rules
Shows the number of security rules currently active and protecting your applications.
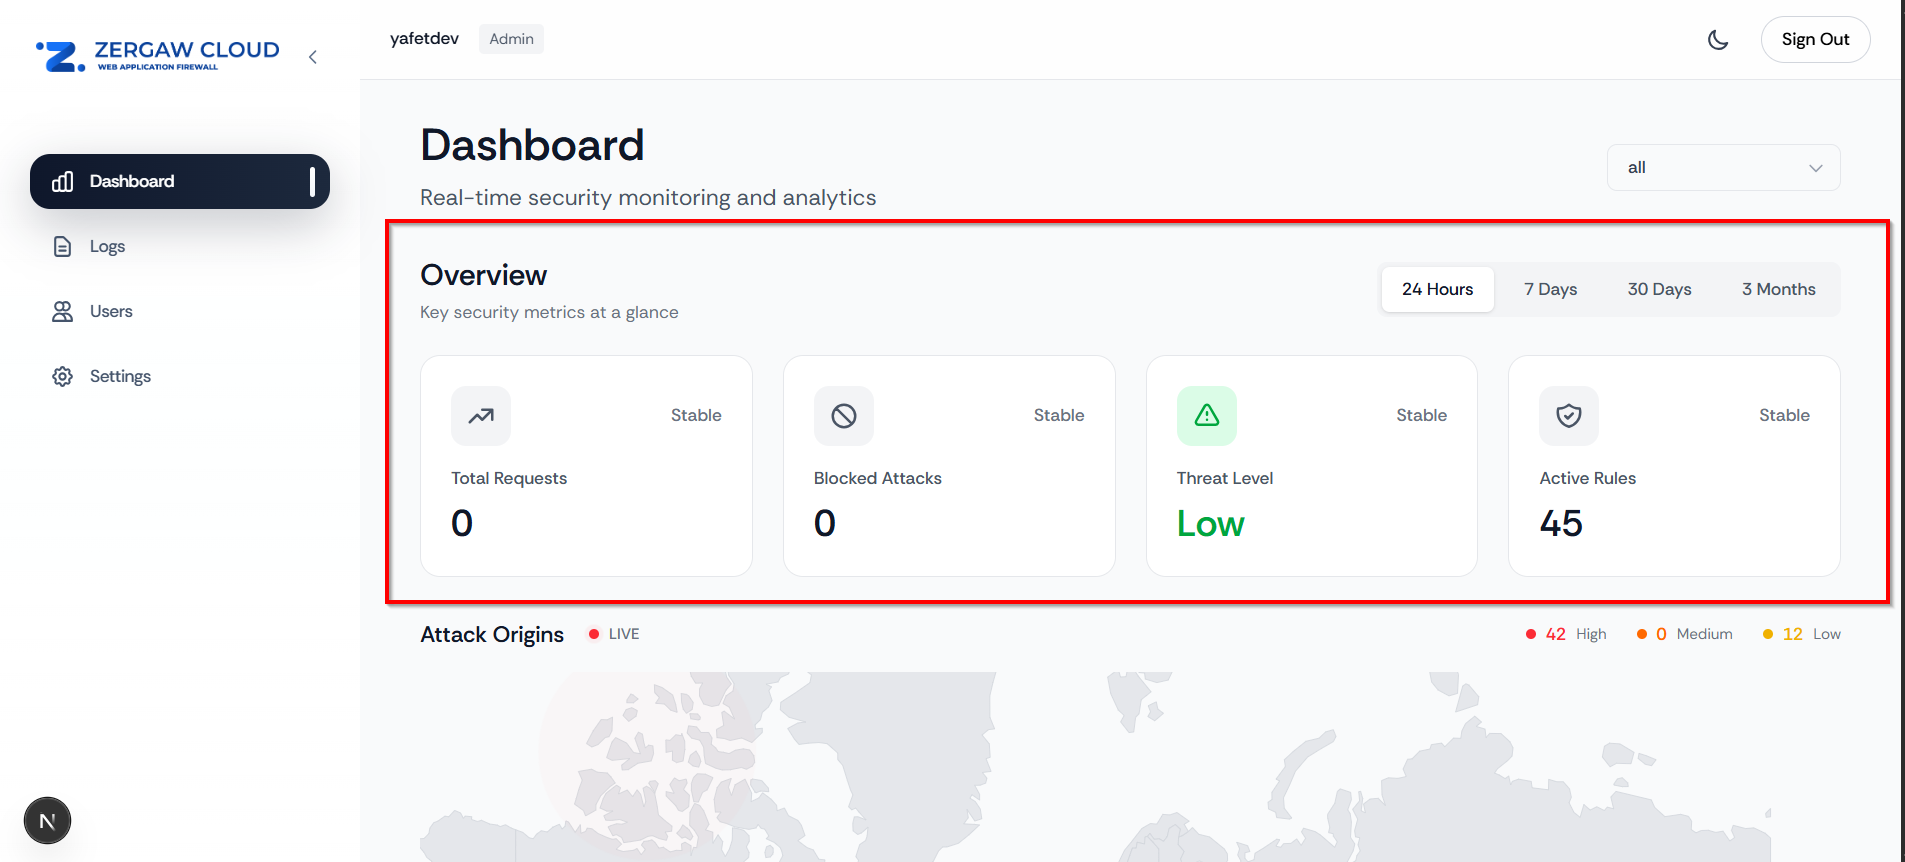
Screenshot: Overview statistics cards showing Total Requests, Blocked Attacks, Threat Level, and Active Rules
¶ 3. Time Range Filtering
Above the Overview statistics, you'll find time range filter buttons that allow you to adjust the time period for all dashboard metrics.
Available time ranges:
- 24 Hours: View metrics from the last 24 hours
- 7 Days: View metrics from the last week
- 30 Days: View metrics from the last month
- 3 Months: View metrics from the last quarter
How to use:
- Click on any time range button
- All dashboard components will automatically update to reflect data from that period
- The selected time range is highlighted
Best practices:
- Use 24 Hours for real-time monitoring and immediate threat detection
- Use 7 Days for weekly security reviews
- Use 30 Days or 3 Months for trend analysis and long-term planning
¶ 4. Attack Origins Map
The Attack Origins Map provides a visual representation of where attacks are coming from geographically. This helps you identify patterns and potential coordinated attacks.
Features:
- Interactive World Map: Click and drag to explore different regions
- Color-coded Markers:
- Red markers: High-severity attacks
- Orange markers: Medium-severity attacks
- Yellow markers: Low-severity attacks
- Marker Size: Larger markers indicate higher attack volumes from that location
- Live Indicator: A pulsing red dot shows that the map is updating in real-time
Severity Breakdown:
Above the map, you'll see a summary showing:
- Number of High severity attacks
- Number of Medium severity attacks
- Number of Low severity attacks
These numbers represent the total count of attacks by severity level across all geographic locations.
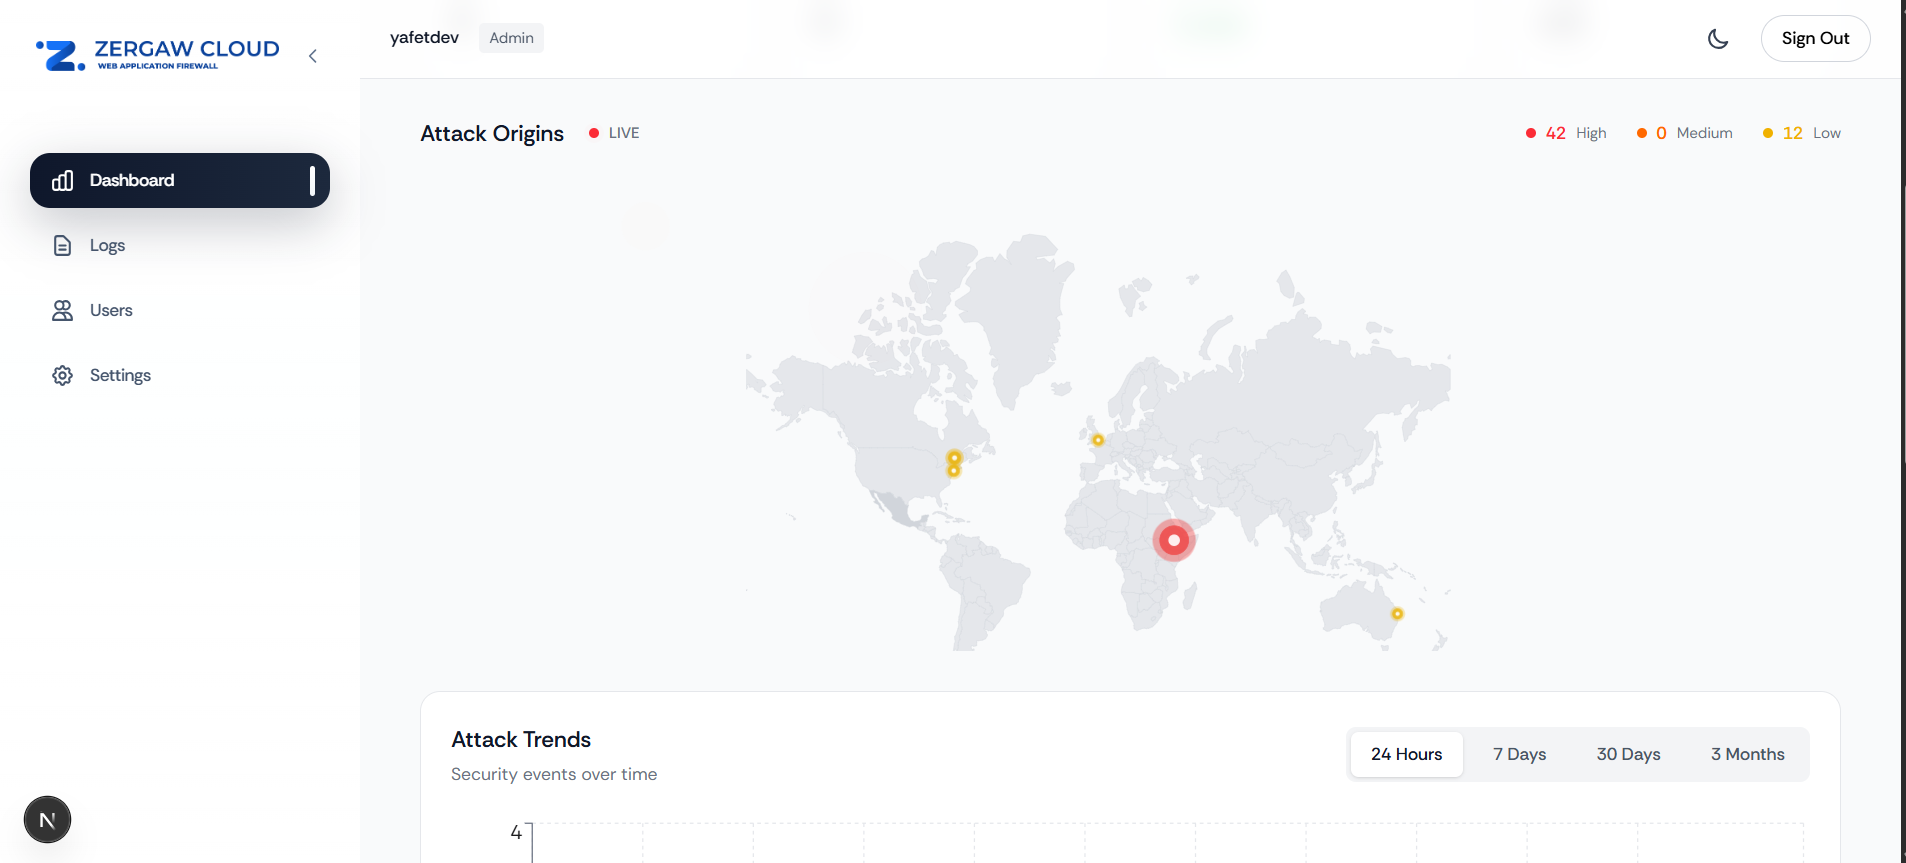
Screenshot: World map showing attack origins with color-coded markers
How to use:
- Hover over any marker to see detailed information about attacks from that location
- Use the zoom controls to focus on specific regions
- Monitor the severity breakdown to prioritize response efforts
- Identify unusual geographic patterns that might indicate coordinated attacks
Interpreting the map:
- Clustered markers in a region may indicate a botnet or coordinated attack
- Isolated high-severity markers may represent targeted attacks
- Widespread low-severity markers typically indicate scanning or reconnaissance activity
¶ 5. Attack Chart
The Attack Chart displays a timeline visualization of attack activity, showing how threats have evolved over the selected time period.
Features:
- Time-based visualization: See attack patterns over hours, days, or months
- Trend analysis: Identify spikes, patterns, and anomalies
- Multiple data series: Compare different types of attacks or severities
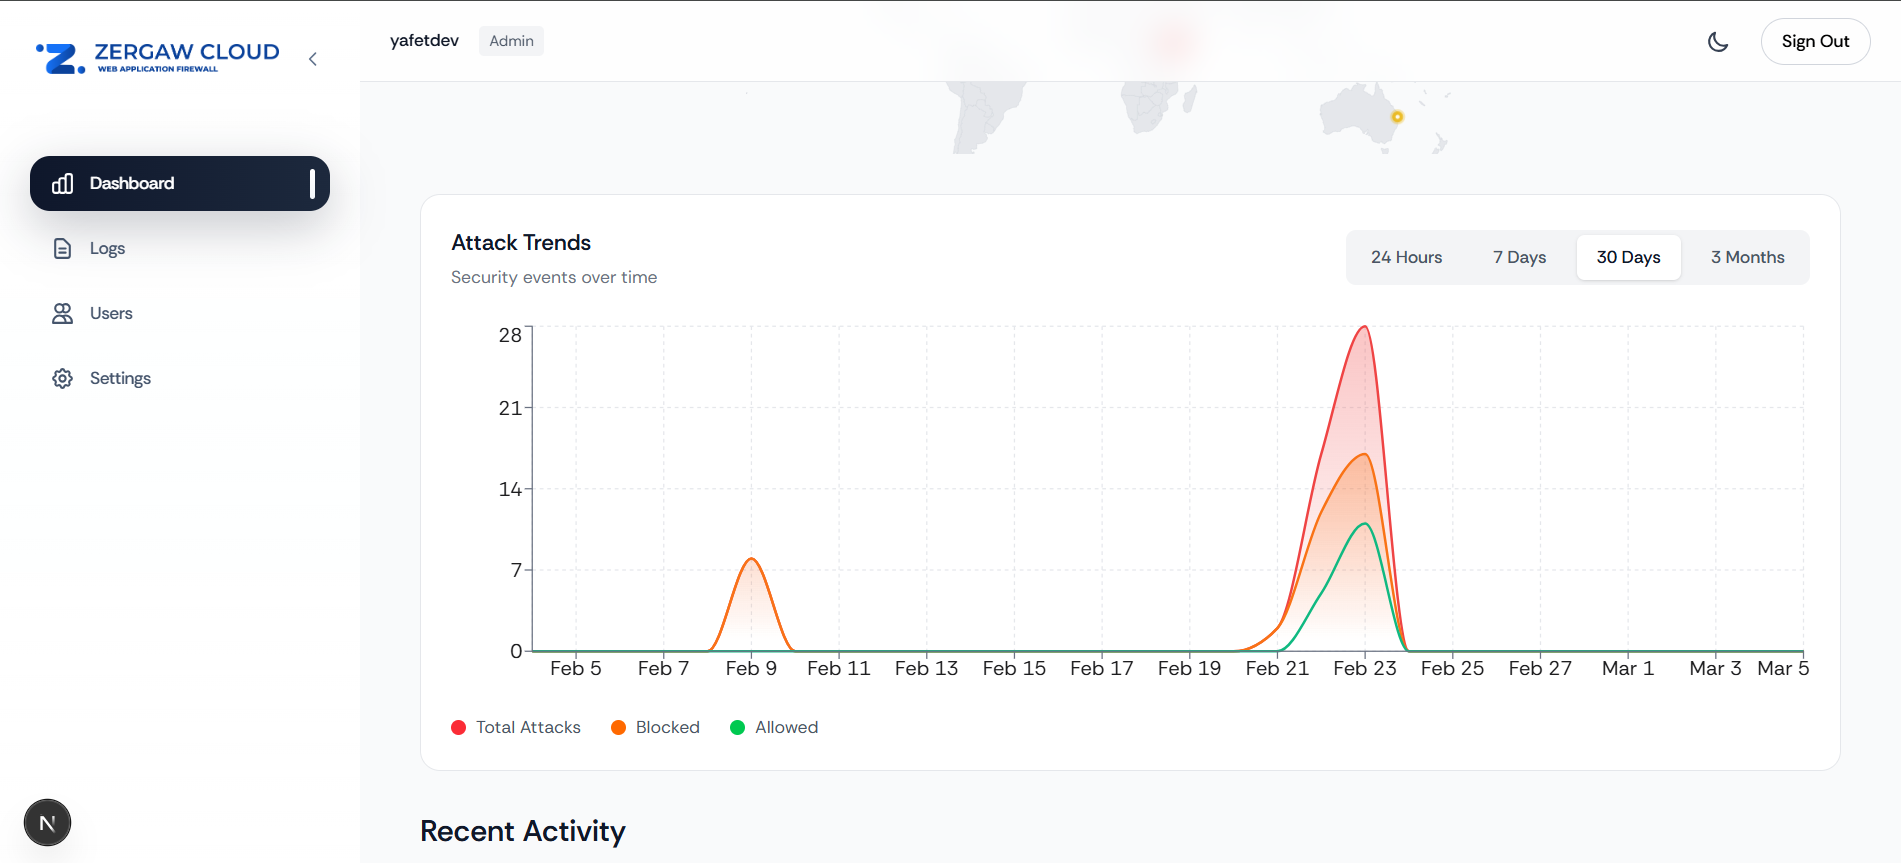
Screenshot: Attack timeline chart showing attack patterns over time
How to use:
- Hover over data points to see exact values and timestamps
- Use the time range filter to adjust the chart's time period
- Look for patterns such as:
- Peak hours: Times when attacks are most frequent
- Attack surges: Sudden increases in attack volume
- Quiet periods: Times with minimal attack activity
What to look for:
- Consistent spikes at certain times may indicate automated attacks
- Gradual increases might suggest a growing threat
- Sudden drops could indicate successful blocking or attack cessation
¶ 6. Recent Activity
The Recent Activity section provides a chronological list of the most recent security events detected by your WAF.
Information displayed:
- Event description: What type of attack or security event was detected
- Source IP address: The IP address from which the attack originated
- Severity indicator: Color-coded dot showing the severity level
- Timestamp: When the event occurred (e.g., "2 minutes ago", "1 hour ago")
Severity colors:
- Red dot: High or Critical severity
- Orange dot: Medium severity
- Yellow dot: Low severity
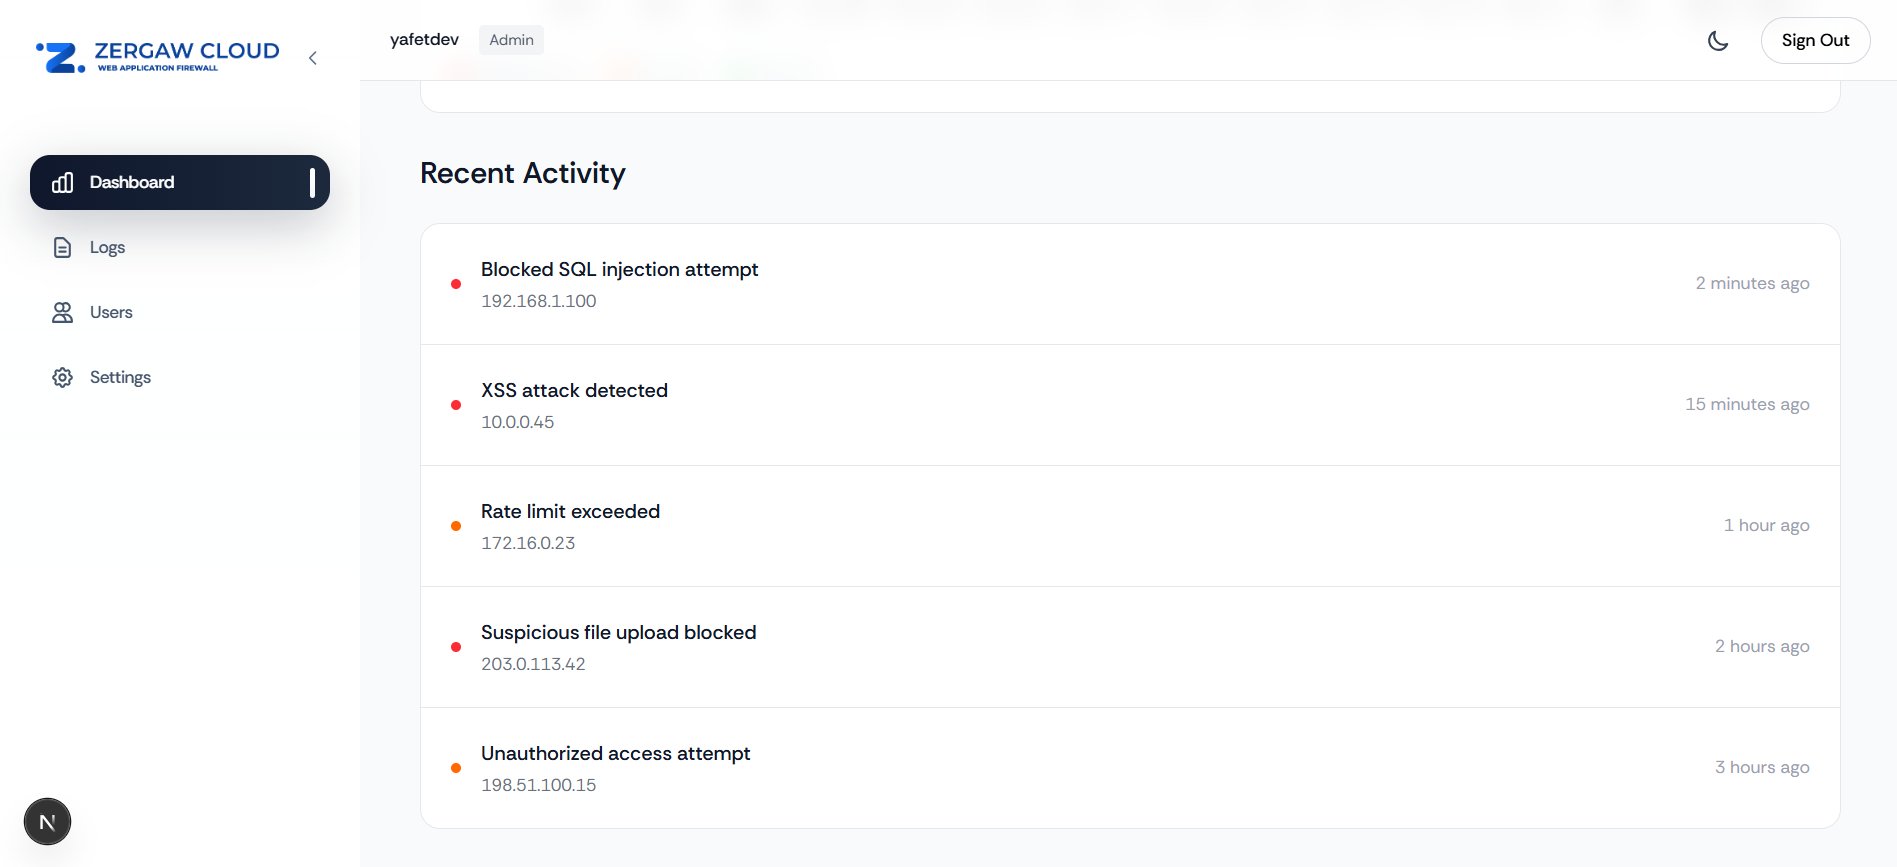
Screenshot: Recent Activity list showing latest security events
How to use:
- Review the most recent events to stay informed about current threats
- Click on any activity item to view more details (if available)
- Monitor the frequency of events to assess overall threat level
- Use the IP addresses to identify repeat offenders
Best practices:
- Check Recent Activity regularly, especially after implementing new security rules
- Pay attention to high-severity events and investigate them promptly
- Track IP addresses that appear frequently for potential blocking
¶ Dashboard Workflow
¶ Daily Monitoring Routine
-
Morning Check (5 minutes)
- Review Recent Activity for overnight events
- Check Threat Level status
- Review Blocked Attacks count
-
Midday Review (10 minutes)
- Examine Attack Origins Map for new geographic patterns
- Review Attack Chart for any unusual spikes
- Filter by specific domains if needed
-
End of Day Analysis (15 minutes)
- Change time range to "24 Hours" for full day review
- Analyze trends in the Attack Chart
- Review all high-severity events in Recent Activity
¶ Weekly Security Review
- Set time range to 7 Days
- Review overall Threat Level trends
- Analyze geographic attack patterns on the map
- Identify any recurring IP addresses in Recent Activity
- Compare Blocked Attacks count with previous weeks
¶ Monthly Planning
- Set time range to 30 Days or 3 Months
- Review long-term trends in the Attack Chart
- Identify seasonal patterns or emerging threats
- Use data to plan security rule updates
- Document any significant changes in attack patterns
¶ Tips for Effective Dashboard Usage
¶ Filtering Strategy
- Start with "All" domains to get the big picture
- Narrow down to specific domains when investigating issues
- Use time ranges to focus on relevant periods
¶ Threat Prioritization
- Critical/High severity events require immediate attention
- Geographic clusters may indicate coordinated attacks
- Repeated IP addresses should be considered for blocking
- Sudden spikes in the chart may indicate active attacks
¶ Performance Monitoring
- Monitor Total Requests to understand traffic patterns
- Compare Blocked Attacks to Total Requests ratio
- Track Threat Level changes over time
¶ Actionable Insights
- Use the Attack Origins Map to identify countries/regions for geo-blocking
- Review Recent Activity to find IPs for IP ban list
- Analyze Attack Chart patterns to optimize security rules
- Use Overview stats to report security posture to stakeholders
¶ Troubleshooting
¶ Dashboard not updating?
- Check your internet connection
- Refresh the page
- Verify you have proper access permissions
¶ Missing data?
- Ensure your domains are properly configured
- Check that WAF is enabled for your domains
- Verify logs are being collected
¶ Can't see specific domain?
- Confirm the domain is added to your organization
- Check domain status in Settings
- Verify you have access permissions for that domain
¶ Next Steps
After reviewing your Dashboard, you may want to:
- View detailed logs: Navigate to the Logs page for in-depth analysis
- Manage security rules: Go to Rules page to enable/disable or create custom rules
- Configure notifications: Set up email or Telegram alerts in Settings
- Block IP addresses: Use IP Ban List to block malicious IPs
- Review settings: Check WAF Settings for domain-specific configurations